How Do We Detect Potential First-Party Financial Fraudsters with Graph Database?
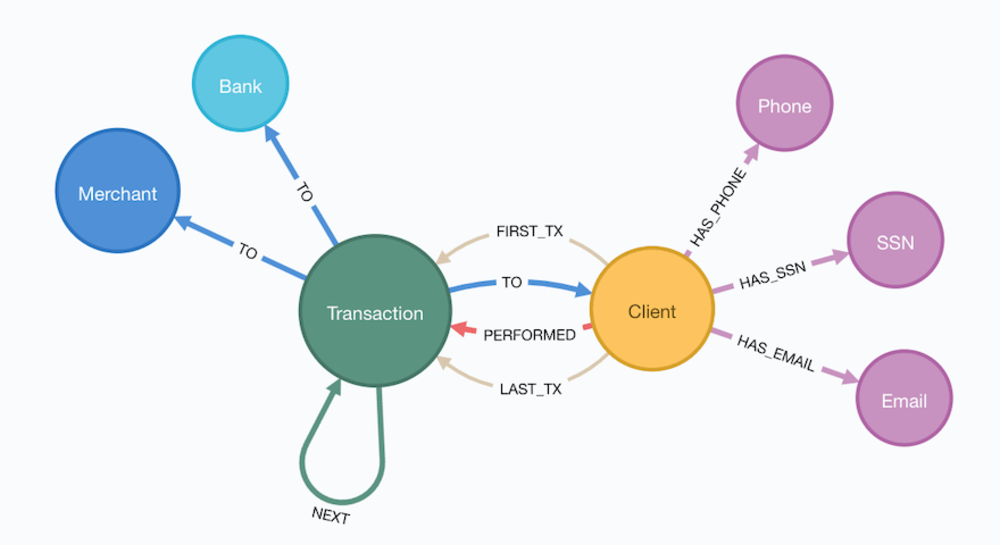
Database Schema
Explore Data
The first step is to explore the PaySim dataset.
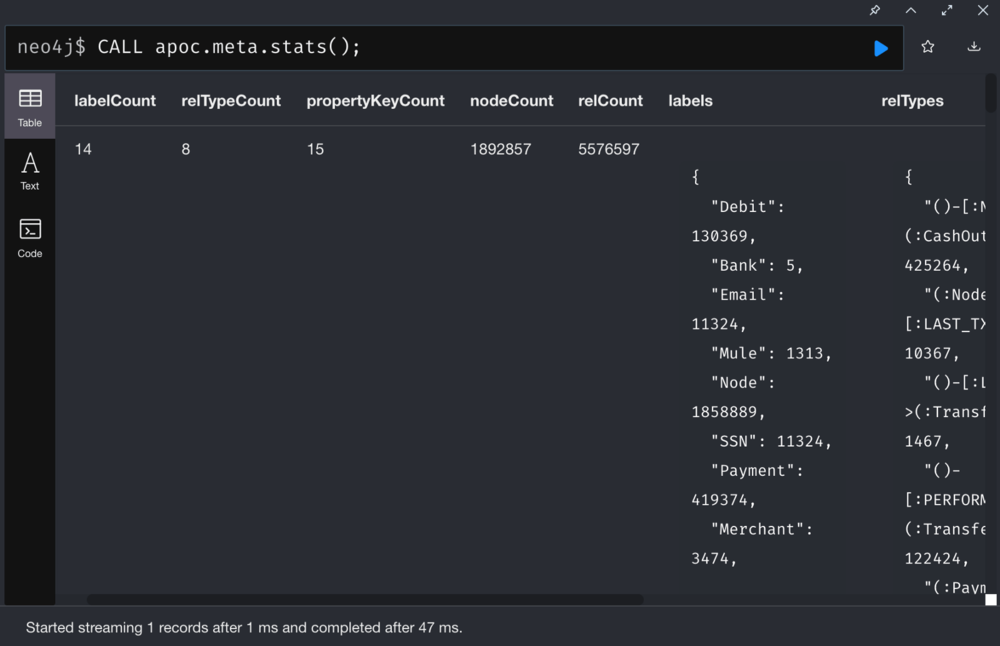
Stats:
Statistics of nodes, node labels, relationships, relationship types
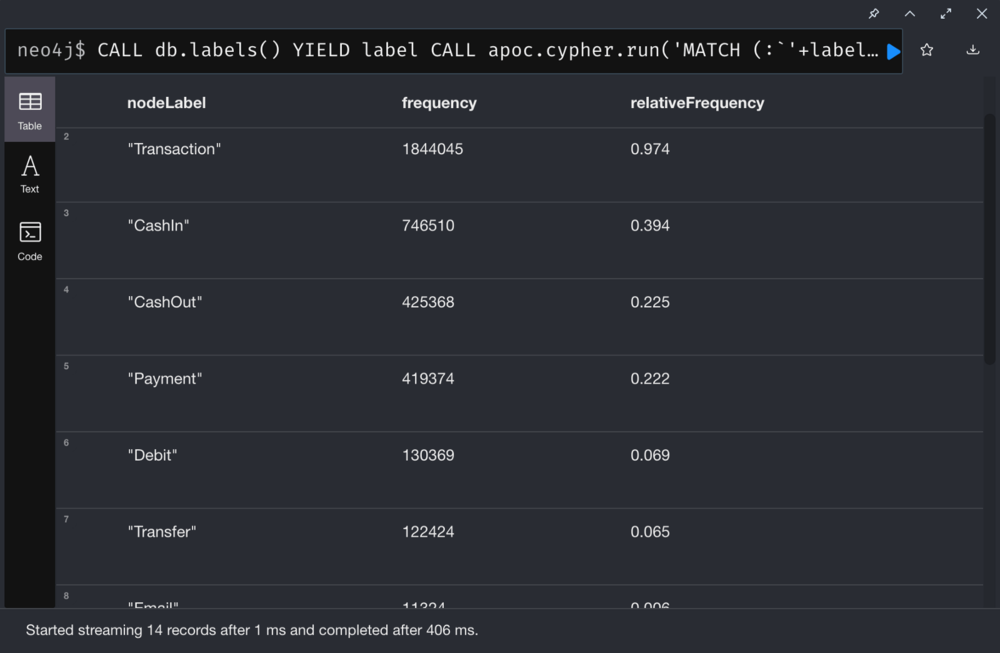
List all nodes and the corresponding relative frequency:
Relative Frequency of Labels in our PaySim Graph
From the above figure, we can tell that most of the transaction activities (62%) come from the CashIn and CashOut of funds in the network.
What’s interesting about the transactions?
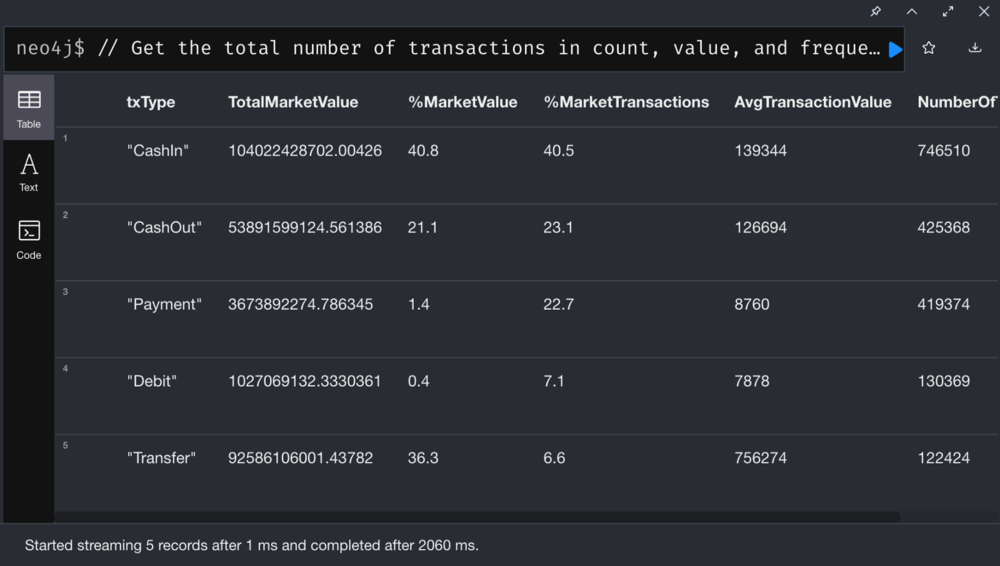
Aggregate Transaction Statistical profile
As we can see, the CashIn transactions dominate the number of transactions and average transaction size. Here’s the interesting part. Despite only a total of 6% in the transaction volume, the transfer accounts for more than 1/3 of the total transaction amount. In fact, the funds involved in the average transfer is about six times that of CashIn!
First-Party Fraud
First-party fraud refers to an individual or a group of people providing false information or identity when applying for financial services.
First-party fraud involves synthetic identity fraud, which is the fastest growing type of fraud, according to McKinsey. Synthetic identity fraud is the use of a combination of real and fake information to create a new identity. It now makes up roughly 80% of the credit card fraud losses, causing heavy losses for financial Institutions.
In PaySim, these fraudsters generate personally identifiable information (PII) such as emails, SSNs and phone numbers, and mix them into different combinations in the network. The fraudsters perform money CashOut in the network through mules, who act as the intermediaries for the illegal fund transfer.
Now let’s catch these fraudulent accounts with the following steps:
Identify clients who share the same personally identifiable information (PII)
Identify client clusters sharing PII using Community Detection Algorithms
Identify similar clients in a client cluster based on the shared PII using Pairwise Similarity Algorithms
Calculate the fraud score for the client cluster with shared PII using Centrality Algorithms.
Use the above scores to flag potential fraudsters.
1. Identify clients who share personally identifiable information (PII)
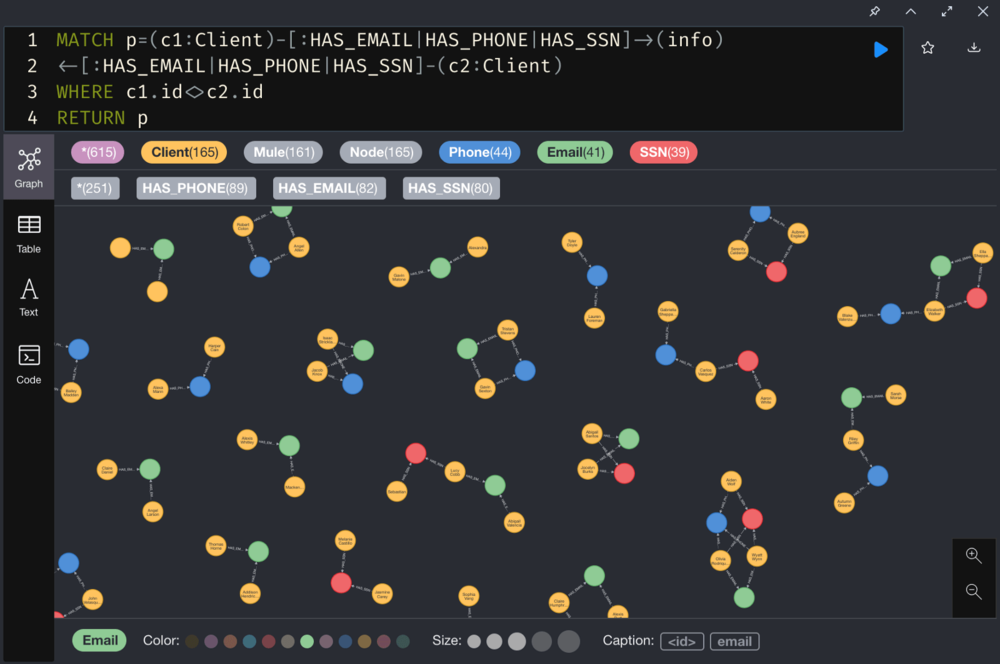
a. Identify pairs of clients sharing PII:
Identify pairs of clients sharing PII
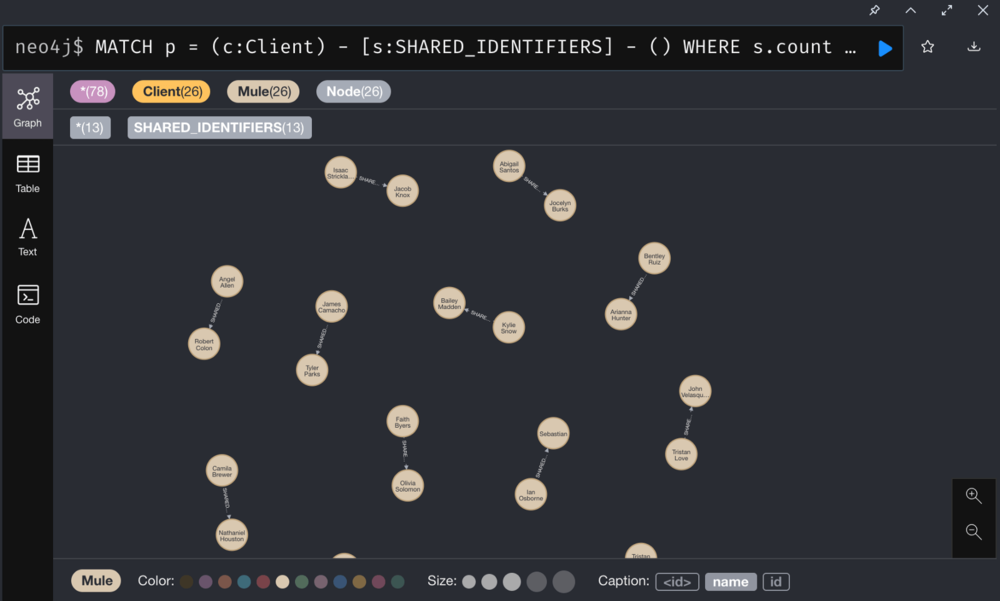
b. Create a new relationship connecting clients who share PII, and add the number of shared PII as an attribute of the relationship
Visualize the new relationship
2. Identify client clusters sharing PII
Run GDS Library’s Community Detection algorithms to identify client clusters sharing PII.
We use Weak Connected Components to find nodes connected to a cluster, where all nodes in the same cluster form a connected component.
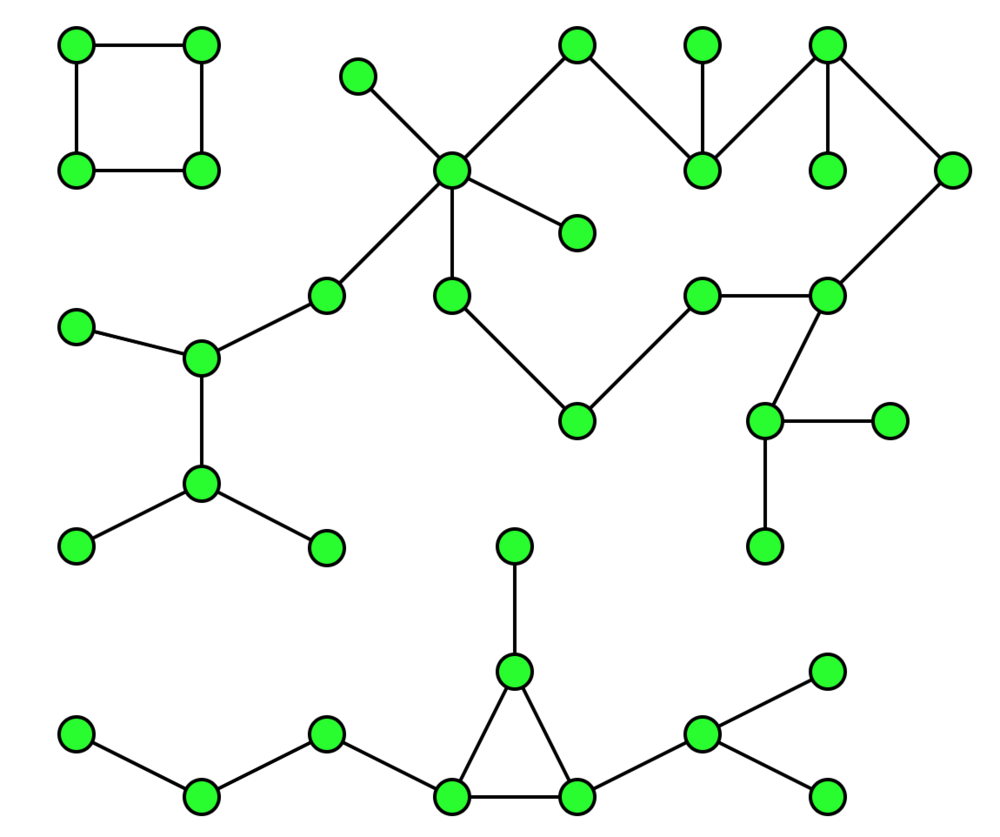
The Weak Connected Components analyze the graph and identify “Graph Components”. A component is a set of nodes and relationships. In these nodes and relationships, each member (node) can be reached from any other node through traversal. The components are weakly connected, as it does not take the directionality of the relationship into consideration.
Weak Connected Components are usually used in the early stages of analysis to understand the structure of the graph.
A graph with three components” by David Eppstein (Public Domain, Wikipedia, 2007)
Visualize clusters of clients sharing information
3. Identify similar clients in client clusters
Run GDS Pairwise Similarity Algorithms to filter clients in the client clusters based on similarity.
The node similarity is based on the relationship with other nodes, which helps us find similar nodes. The node similarity uses the Jaccard distance to calculate the similarity score of a pair of nodes by observing the related nodes shared by the two nodes in the network divided by the sum of all nodes that have been related to the two nodes.
Visualize how similar clients are based on similarity score
4. Calculate the Fraud Score
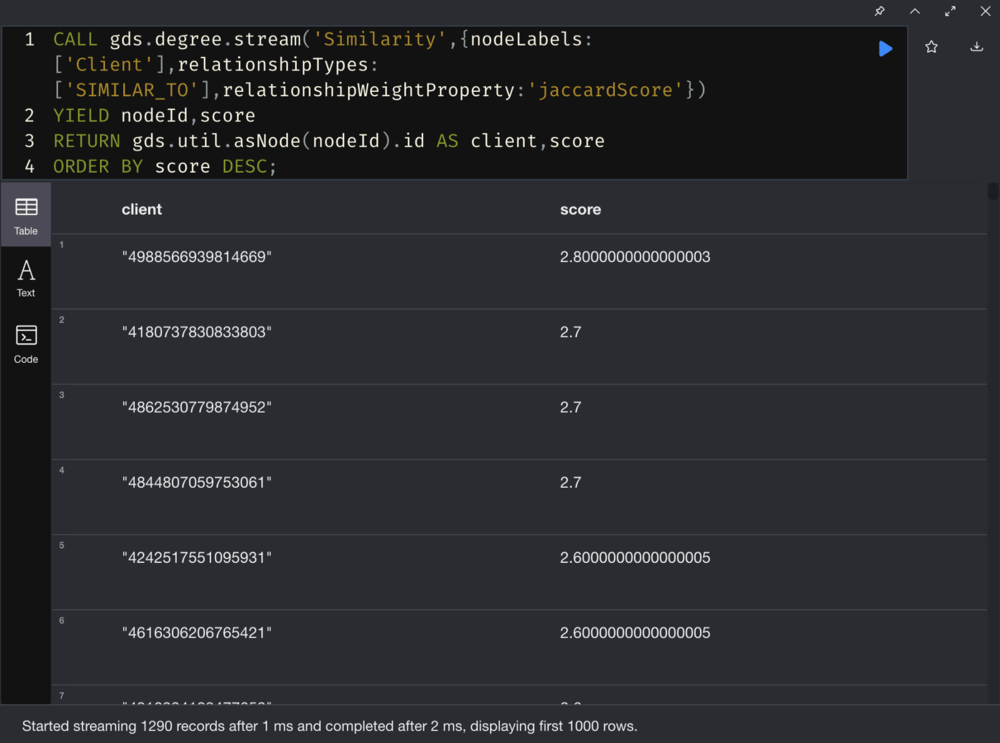
Use a Degree Centrality, a Centrality Algorithms, to add up the Jaccard Scores on the incoming and outgoing relationships of a given node in the cluster, and assign the scores to the corresponding Fraud Score. Let’s say the higher the Fraud Score, the more likely the fraud occurs.
Calculating centrality score using Degree Centrality
5. Add labels to potential fraudsters
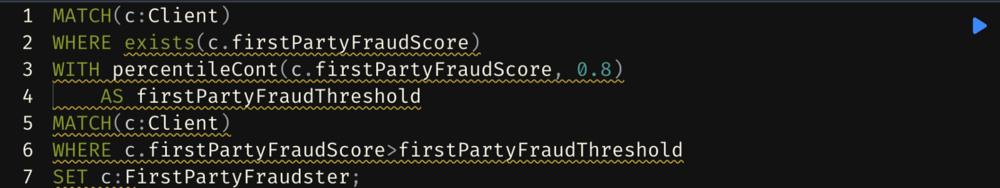
Explore clients whose first-party fraud scores exceeds a certain threshold. Here we use the 80th percentile as the threshold value.
Adding labels to Clients based on fraud score
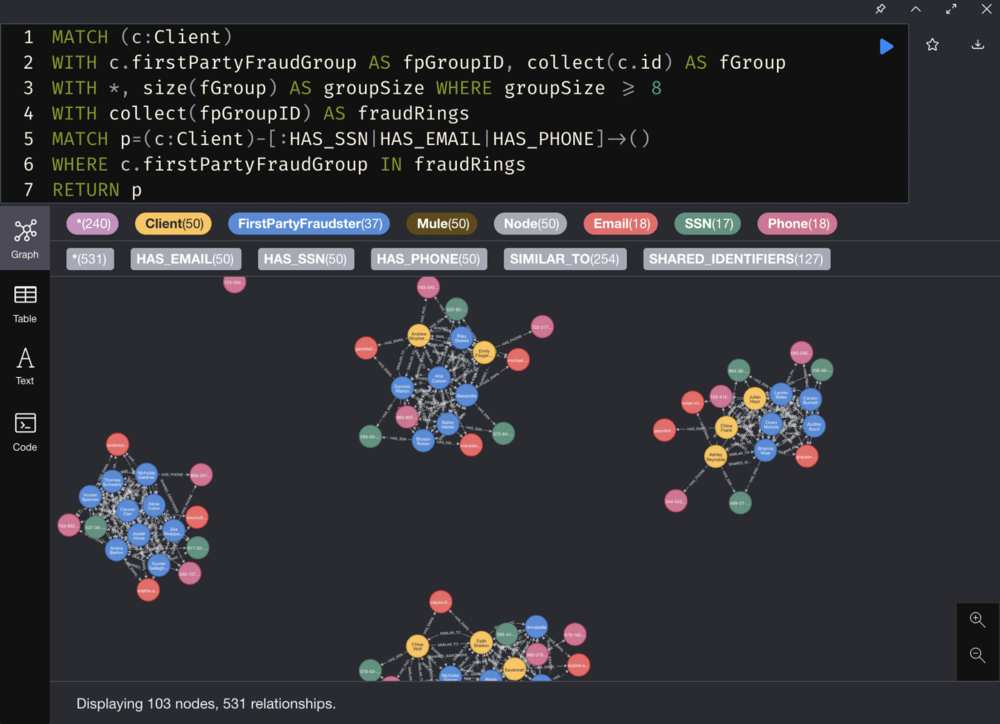
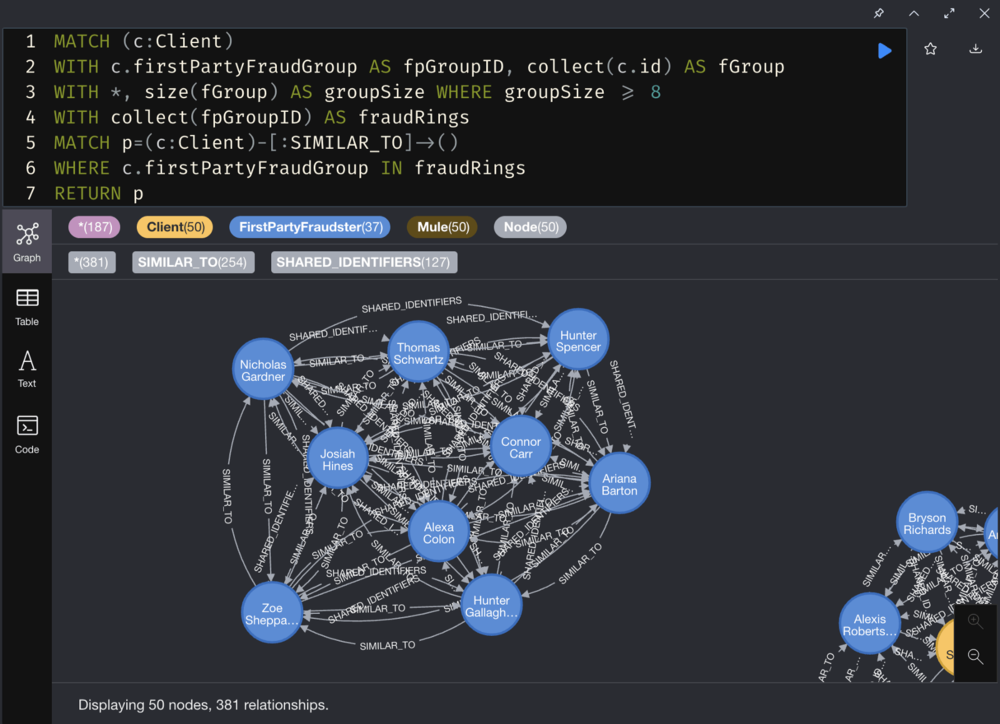
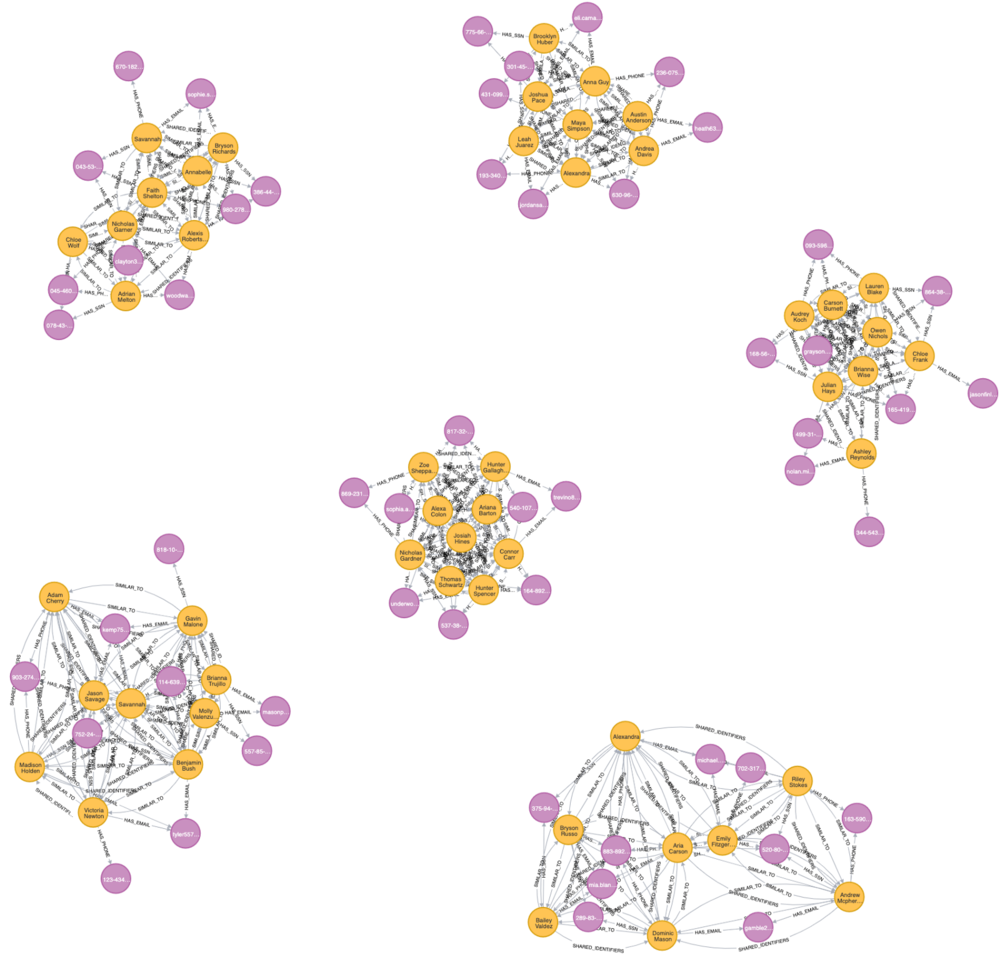
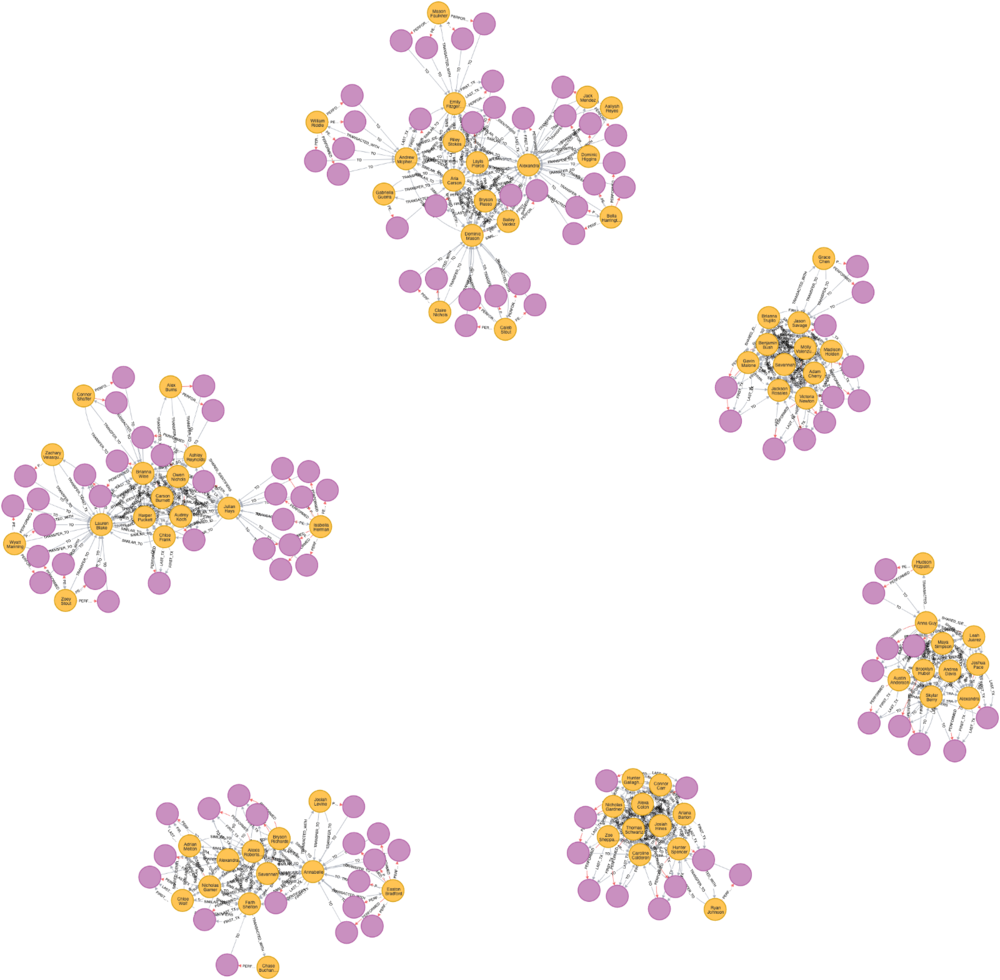
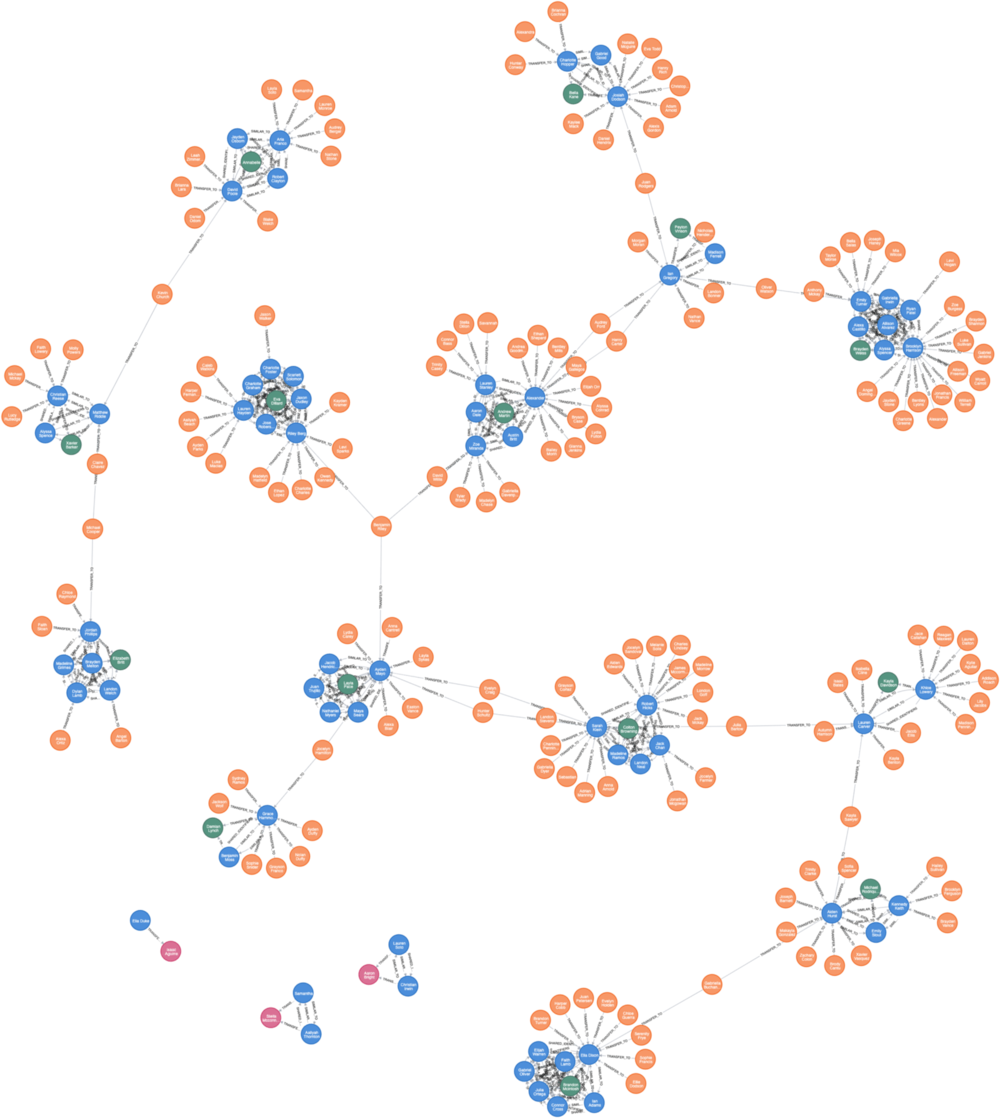
Our Fraud Groups (of size >7)
From the above figure, we can see that the six clusters contain a few clients (yellow nodes) who seem to share PII (purple nodes) such as SSNs, Emails and phone numbers.
Identify 2nd-Level Fraudster
Now that we have identified some suspicious client clusters, let’s move on to investigate other clients that have transactions with these suspicious clients.
Find out who is related to these fraudster clusters.
External Transactions with our Large Fraud Groups
Creating new relationships
Create a TRANSFER_TO relationship between clients with the firstPartyFraudster label and clients who don’t but have transactions with the fraudsters, and add the total amount of this type of transaction as an attribute to TRANSFER_TO.
Newly created TRANSFER_TO relationship
Find out 2nd-level Fraudsters
Identify clients who may have colluded with first-party fraudsters and have not been identified as potential first-party fraudsters.
Our assumption is that clients who conduct transfer transactions with first-party fraudsters can be suspected as 2nd-level fraudsters.
Let’ use the TRANSFER_TO relationships we just created, and perform the following steps to identify these clients:
Use the Community Detection Algorithm (WCC) to identify the client networks related to first-party fraudsters.
Use the Centrality Algorithm (Page Rank) to calculate a Fraud Score.
Identify suspects with relatively high Page Ranks and mark them as 2nd-level fraudsters.
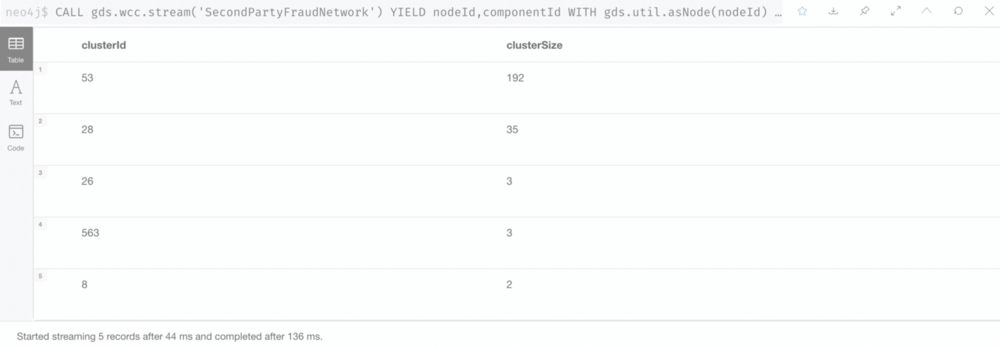
1. Identify the client networks related to first-party fraudsters with WCC.
Execute WCC to find clusters
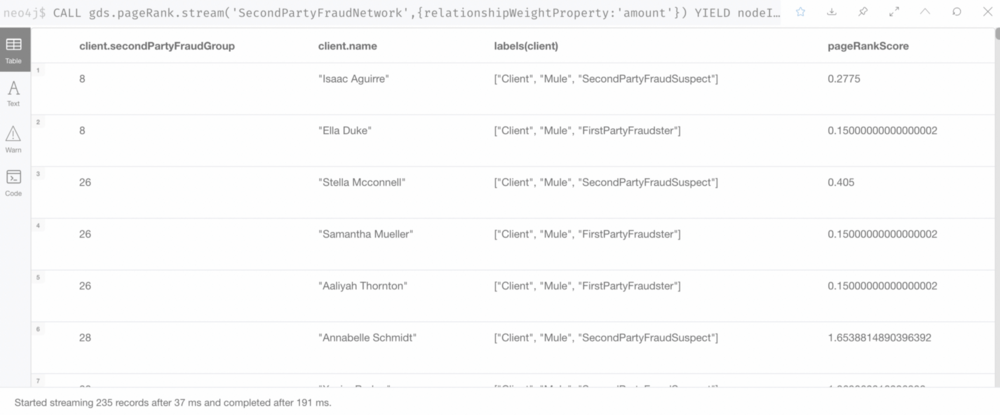
2. Use the Centrality Algorithm (Page Rank) to calculate a Fraud Score.
With Page Ranks, we can pin down the suspects based on the calculation results of Fraud Scores.
Page Rank Score
3. Identify suspects with relatively high Page Ranks and mark them as 2nd-level fraudsters.
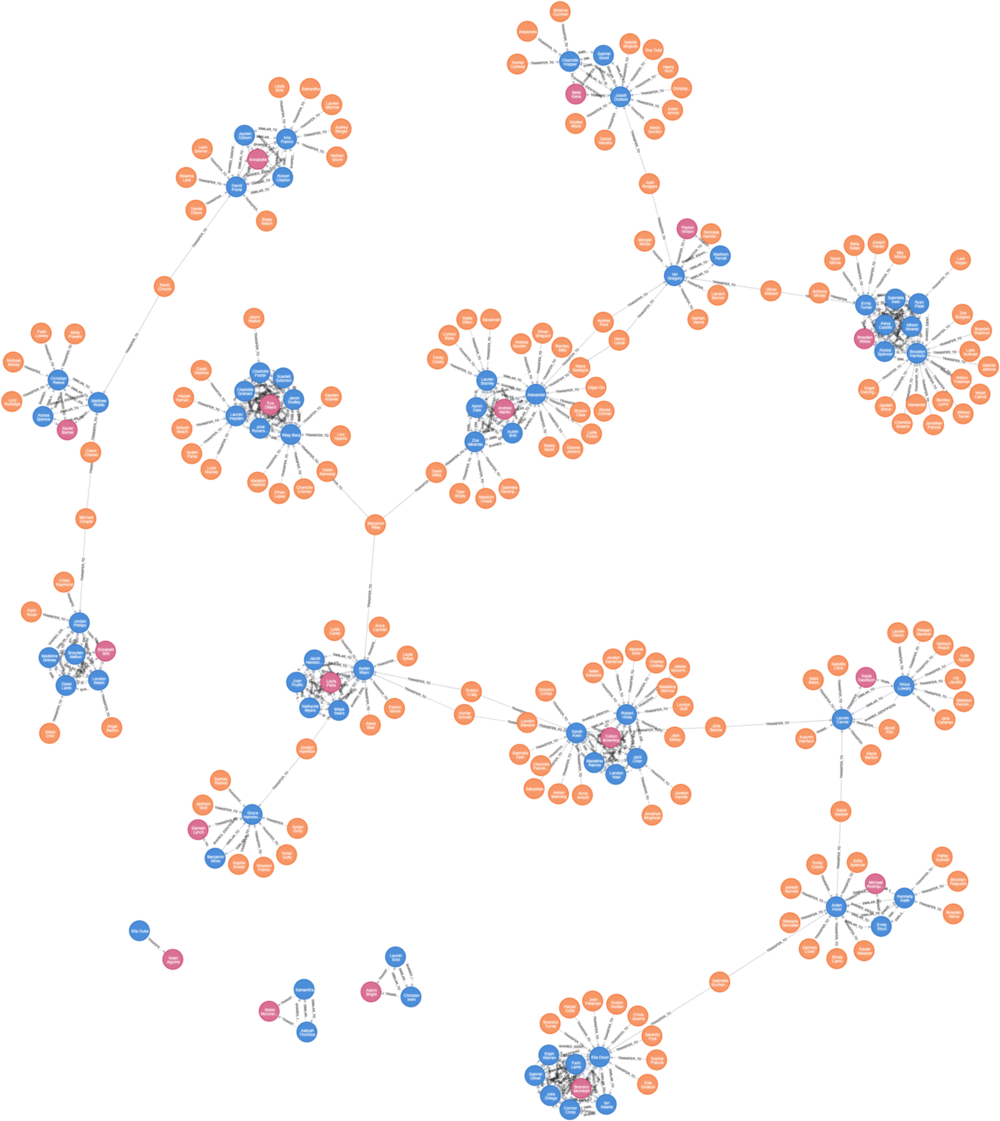
2nd-level Fraudsters networks
Let's Summarize the First Part: What Did We Find Out?
To sum up, we use GDS to perform financial transaction data analysis:
We use WCC and Degree Centrality algorithms to filter out potential first-party fraudsters.
We identify the 2nd-level fraudsters associated with the first-party fraudsters using new fraudsters relationships (TRANFER_TO), WCC and Page Rank algorithms.
We add labels to these suspects in the current network.
In the next chapter, we will leverage machine learning to predict financial fraud.