HomePage » Fraud Detection (2) Financial Fraud Detection: Leveraging Neo4j Graph Database to Identify Potential Fraudsters
- Author | Tangwei Hung
Financial Fraud Detection: Leveraging Neo4j Graph Database to Identify Potential Fraudsters

How Do We Detect Potential First-Party Financial Fraudsters with Graph Database?
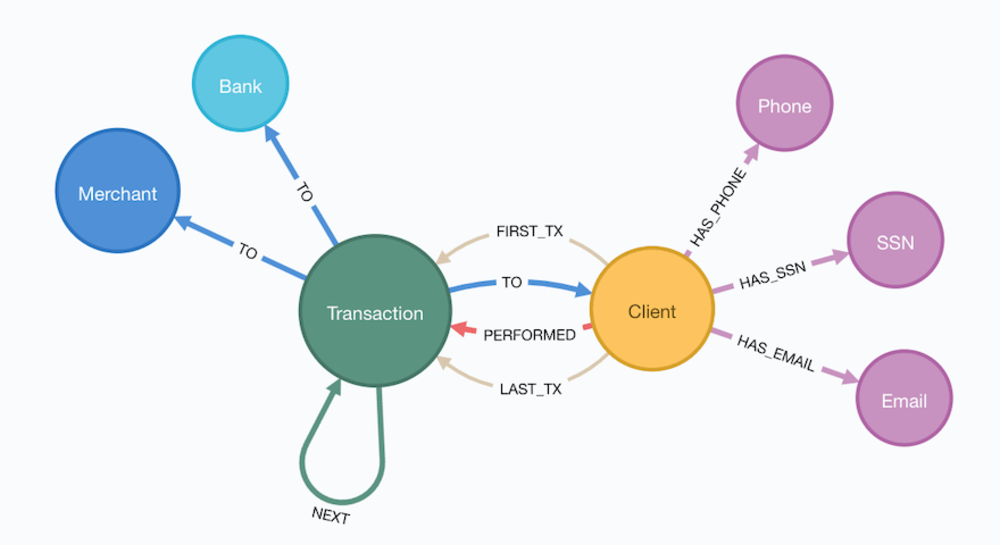
Explore Data
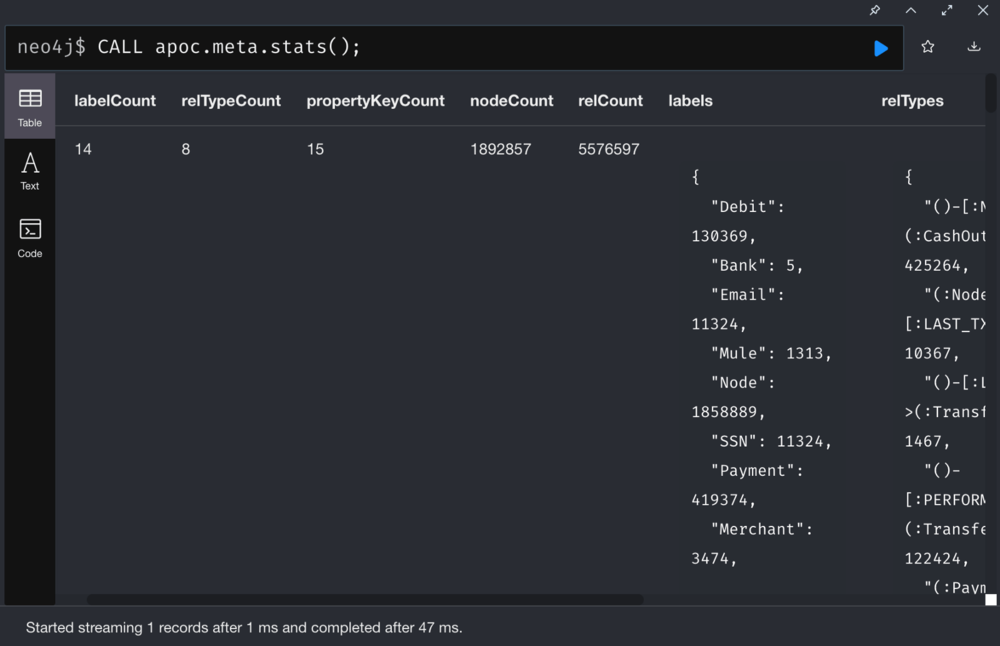
Stats:
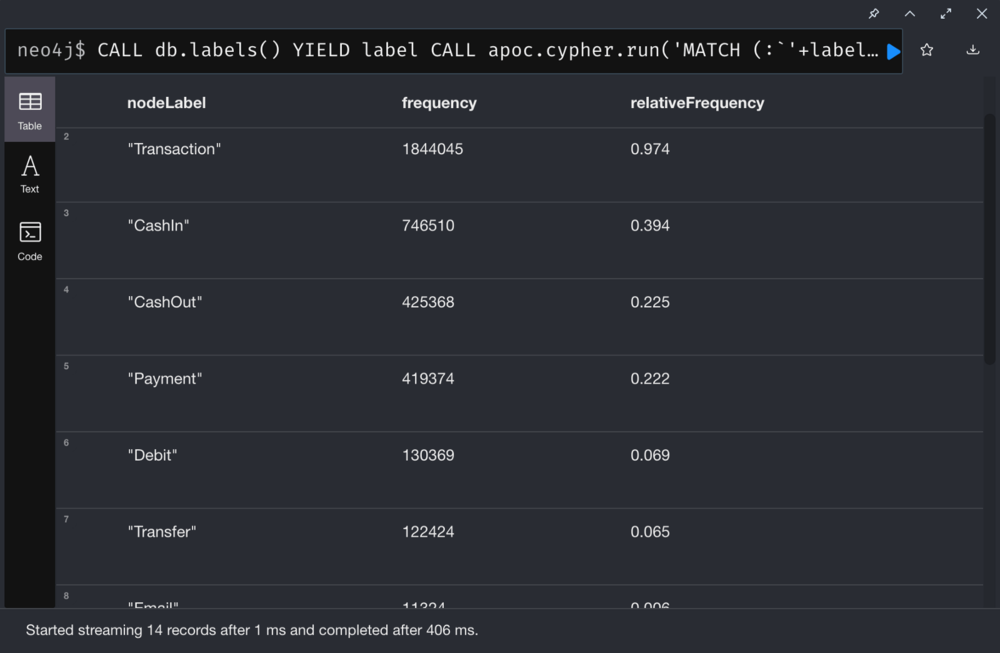
List all nodes and the corresponding relative frequency:
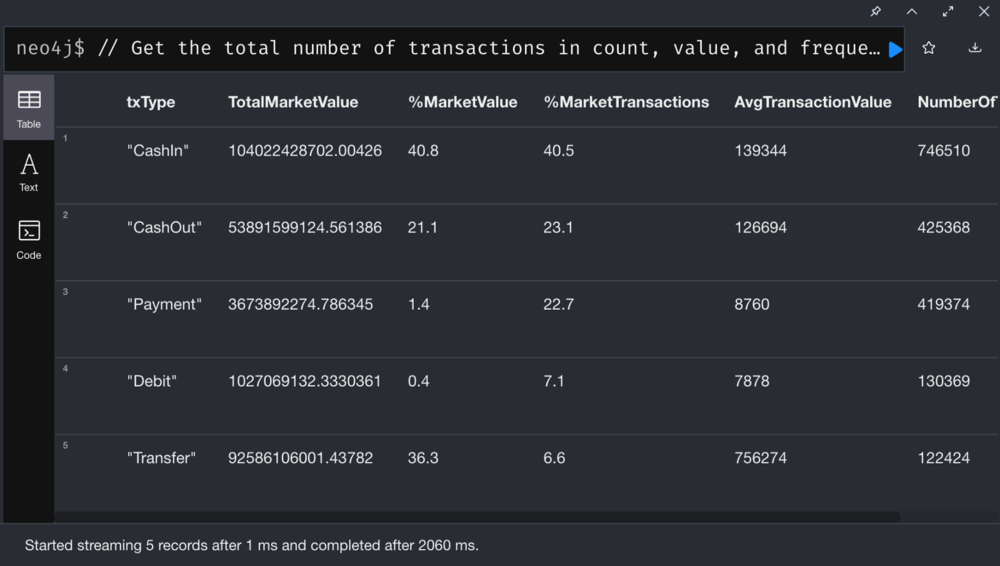
First-Party Fraud
First-party fraud refers to an individual or a group of people providing false information or identity when applying for financial services.
First-party fraud involves synthetic identity fraud, which is the fastest growing type of fraud, according to McKinsey. Synthetic identity fraud is the use of a combination of real and fake information to create a new identity. It now makes up roughly 80% of the credit card fraud losses, causing heavy losses for financial Institutions.
Now let’s catch these fraudulent accounts with the following steps:
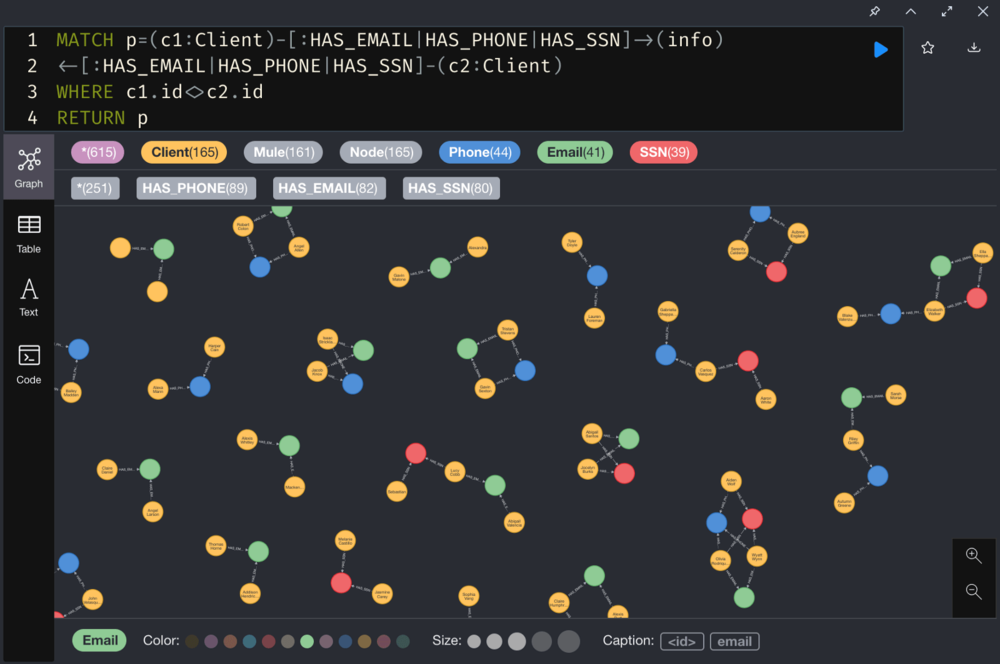
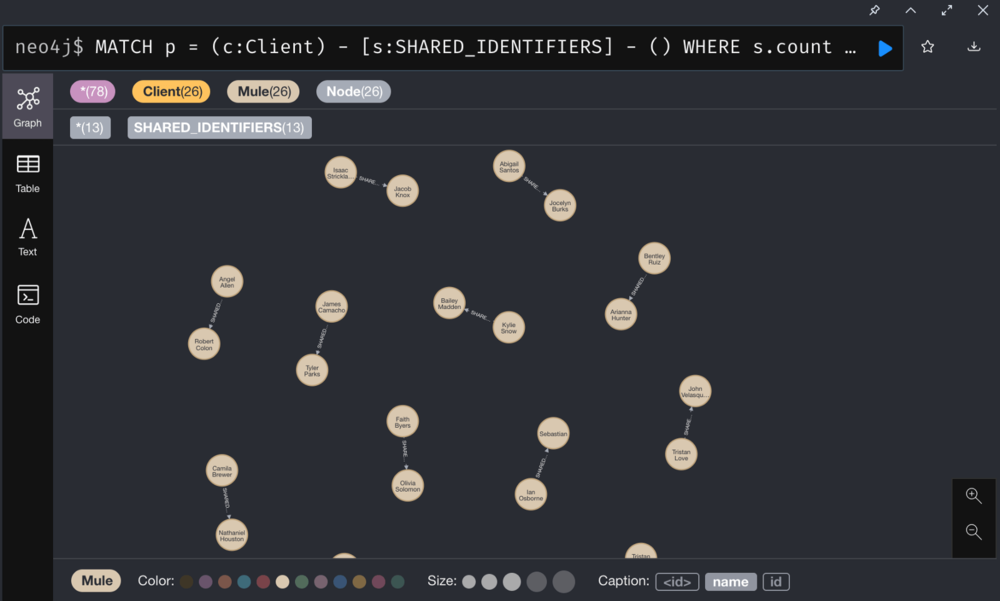
- Identify clients who share the same personally identifiable information (PII)
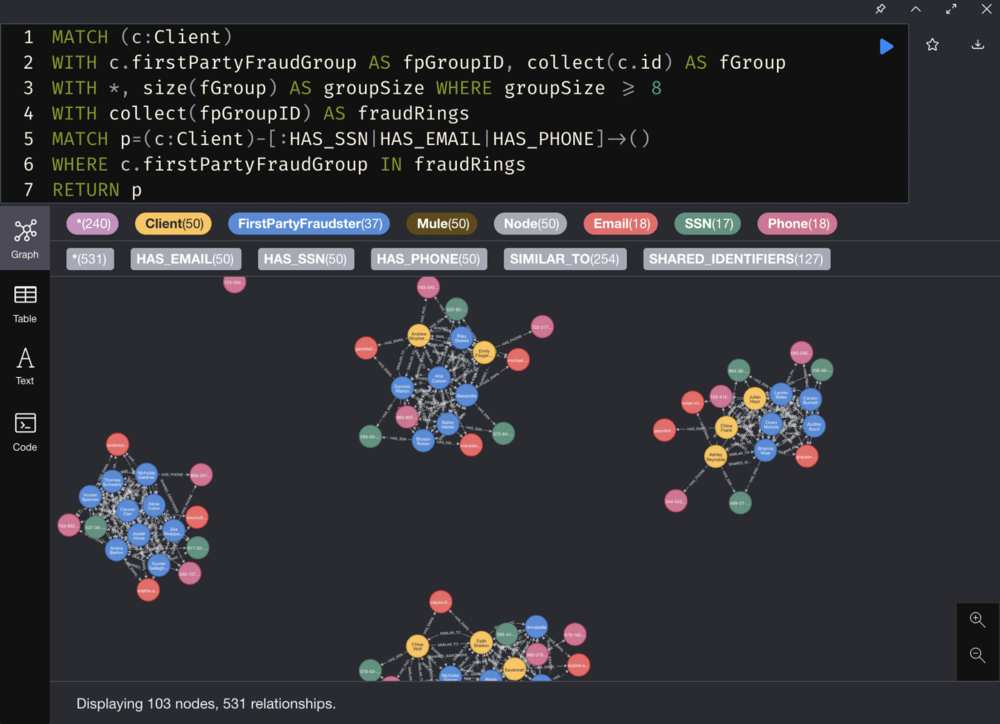
- Identify client clusters sharing PII using Community Detection Algorithms
- Identify similar clients in a client cluster based on the shared PII using Pairwise Similarity Algorithms
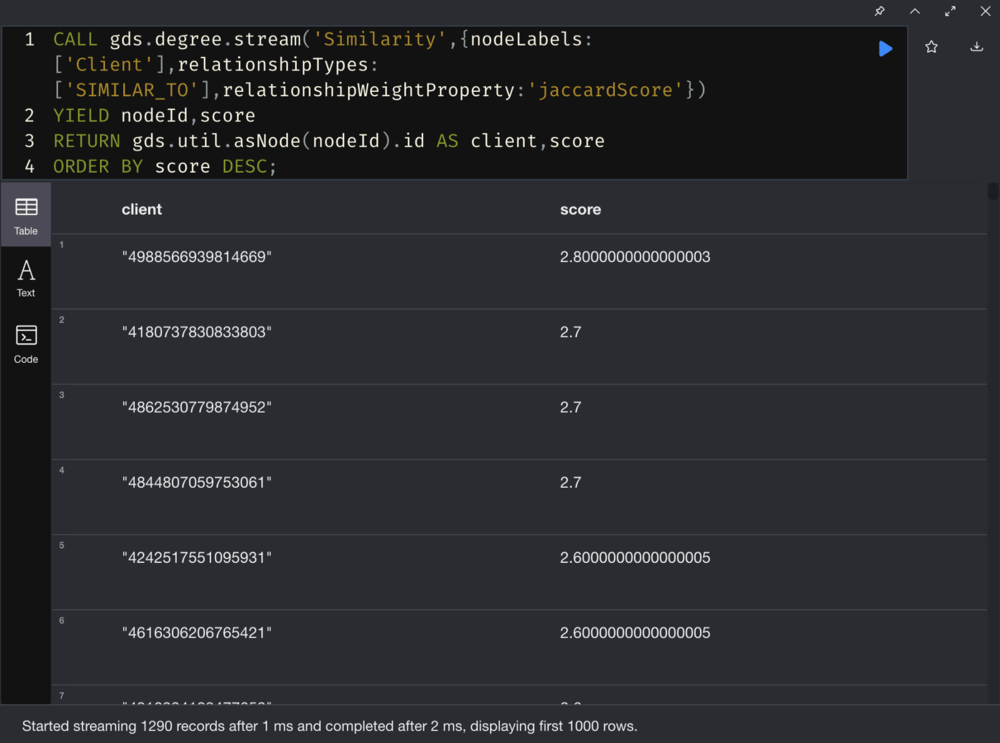
- Calculate the fraud score for the client cluster with shared PII using Centrality Algorithms.
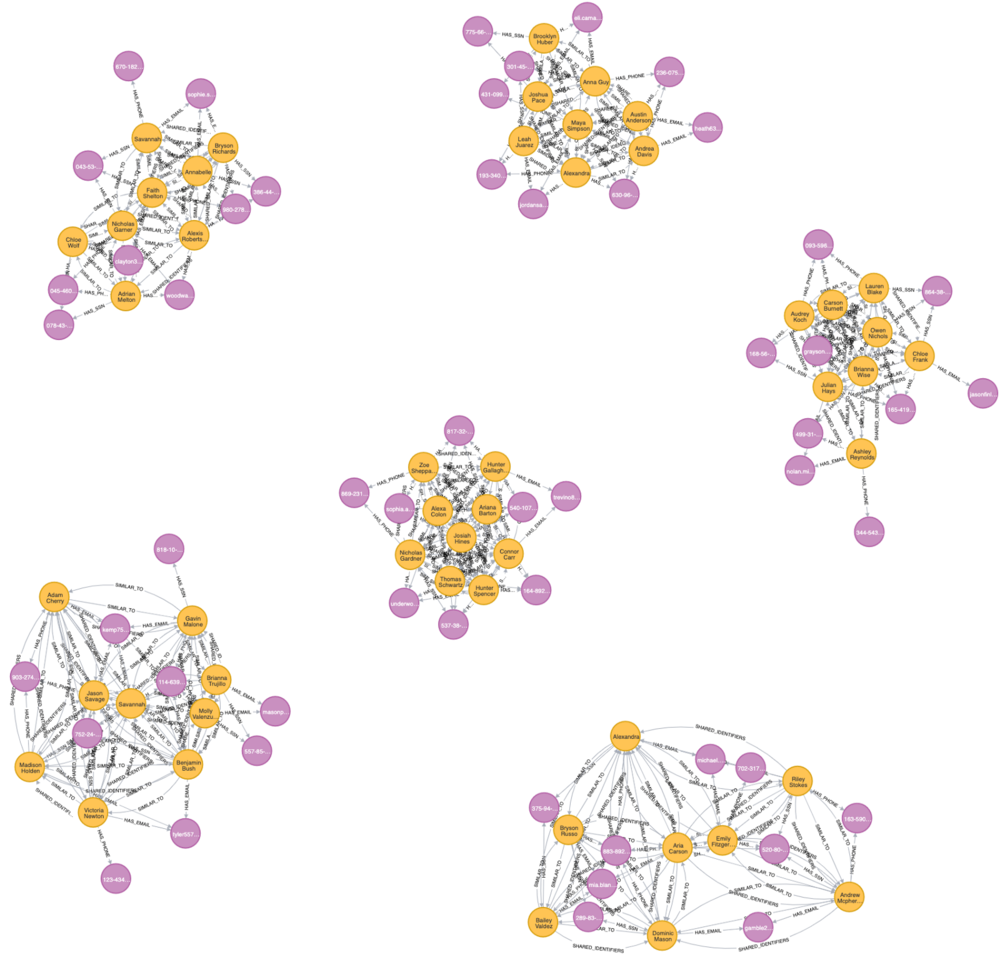
- Use the above scores to flag potential fraudsters.
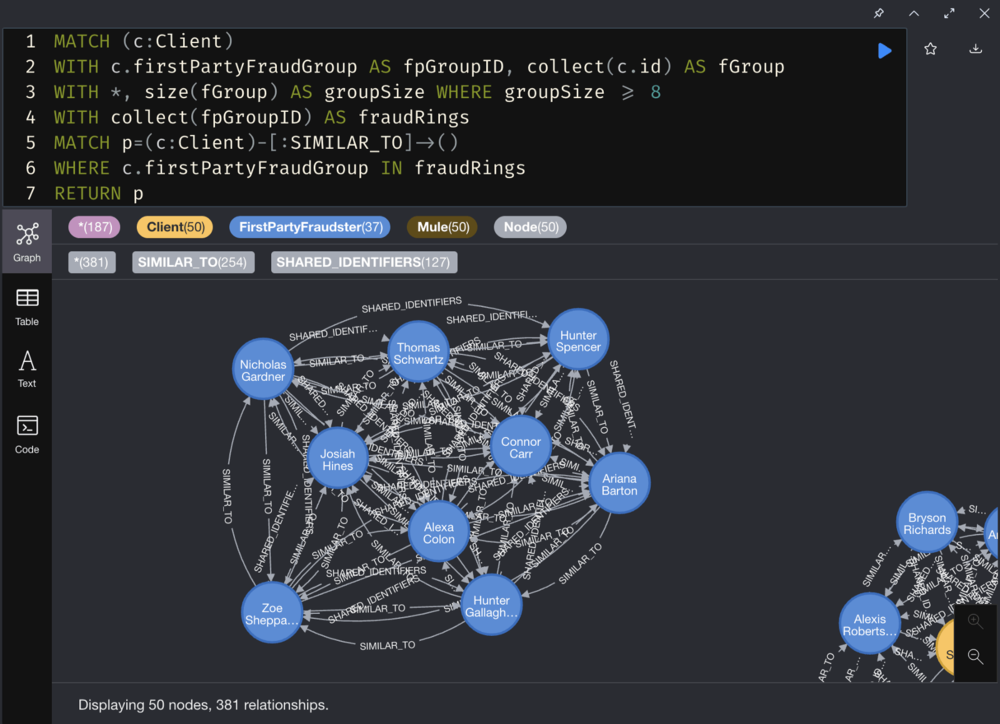
1. Identify clients who share personally identifiable information (PII)
2. Identify client clusters sharing PII
Run GDS Library’s Community Detection algorithms to identify client clusters sharing PII.
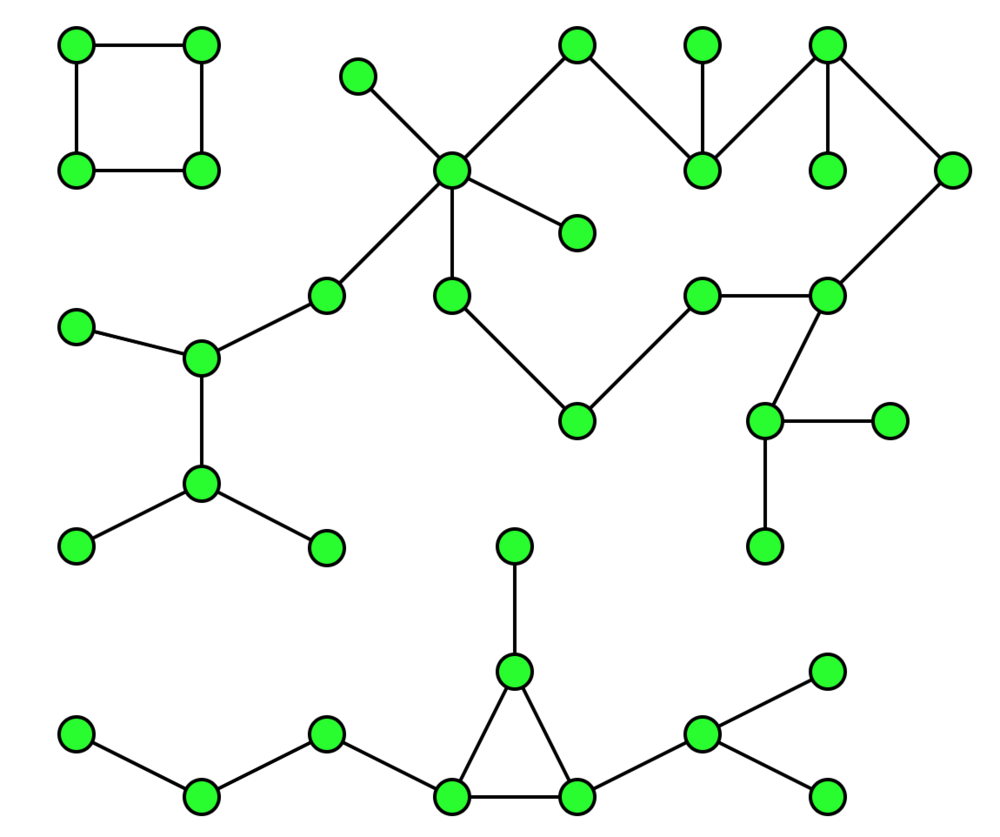
We use Weak Connected Components to find nodes connected to a cluster, where all nodes in the same cluster form a connected component.
The Weak Connected Components analyze the graph and identify “Graph Components”. A component is a set of nodes and relationships. In these nodes and relationships, each member (node) can be reached from any other node through traversal. The components are weakly connected, as it does not take the directionality of the relationship into consideration.
Weak Connected Components are usually used in the early stages of analysis to understand the structure of the graph.
Reference: Weakly Connected Components — Neo4j Graph Data Science
3. Identify similar clients in client clusters
Run GDS Pairwise Similarity Algorithms to filter clients in the client clusters based on similarity.
The node similarity is based on the relationship with other nodes, which helps us find similar nodes. The node similarity uses the Jaccard distance to calculate the similarity score of a pair of nodes by observing the related nodes shared by the two nodes in the network divided by the sum of all nodes that have been related to the two nodes.
Reference: Node Similarity — Neo4j Graph Data Science
4. Calculate the Fraud Score
5. Add labels to potential fraudsters

Identify 2nd-Level Fraudster
Find out who is related to these fraudster clusters.
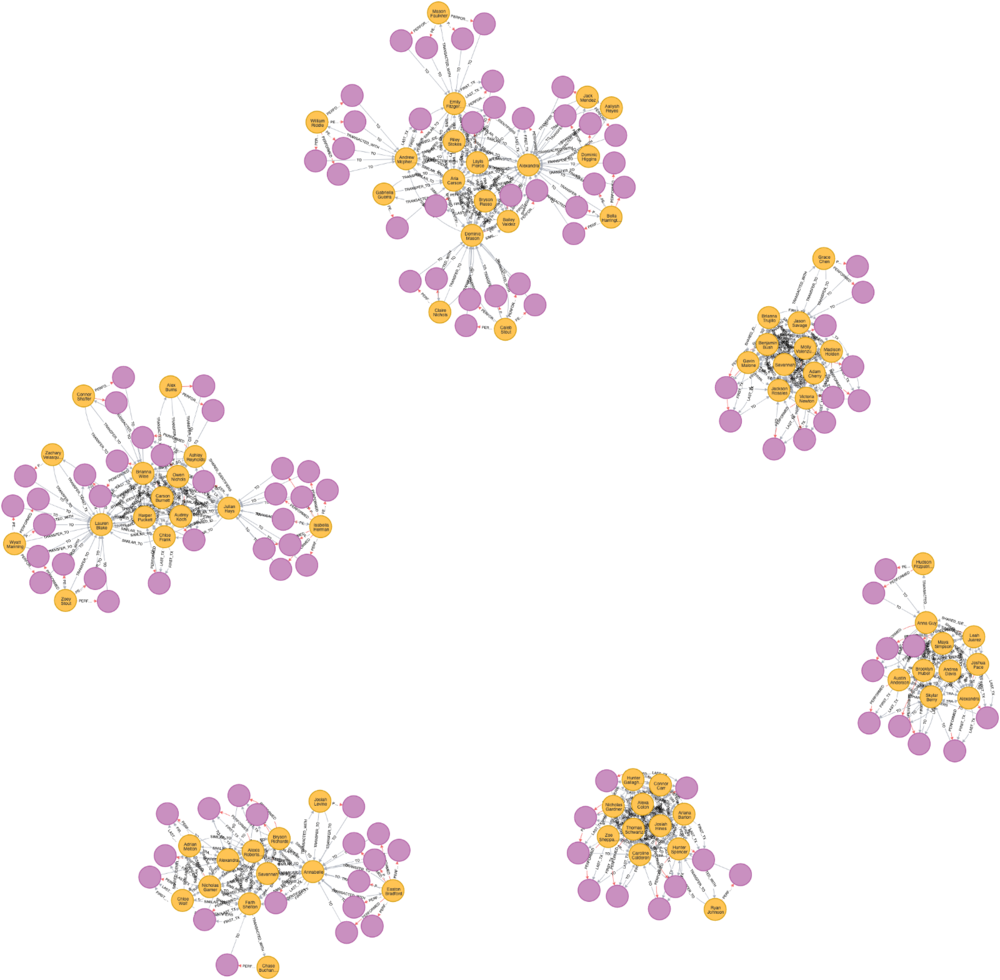
Creating new relationships
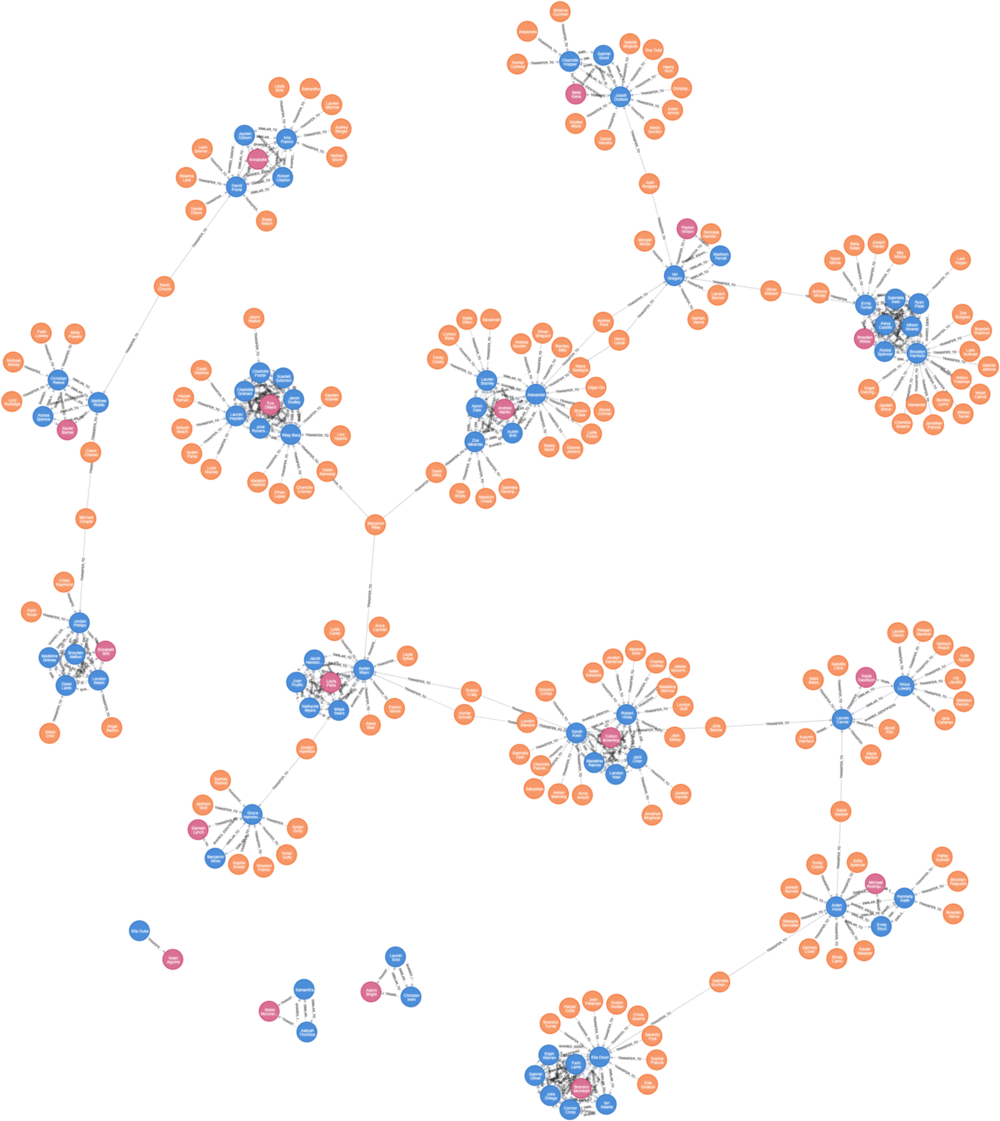
Find out 2nd-level Fraudsters
Identify clients who may have colluded with first-party fraudsters and have not been identified as potential first-party fraudsters.
Our assumption is that clients who conduct transfer transactions with first-party fraudsters can be suspected as 2nd-level fraudsters.
Let’ use the TRANSFER_TO relationships we just created, and perform the following steps to identify these clients:
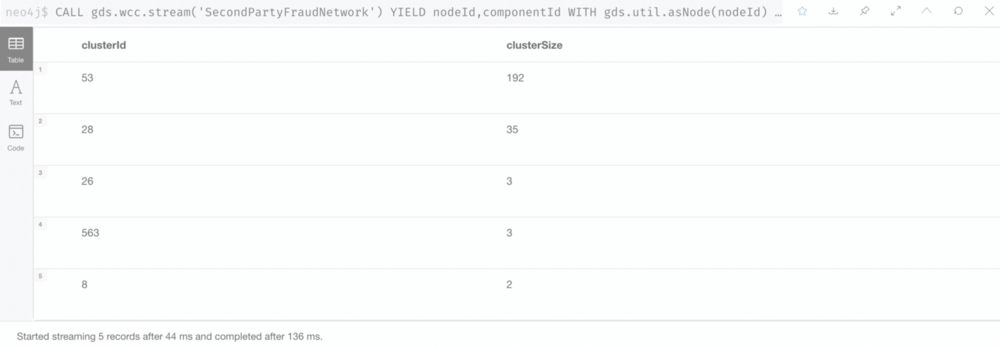
- Use the Community Detection Algorithm (WCC) to identify the client networks related to first-party fraudsters.
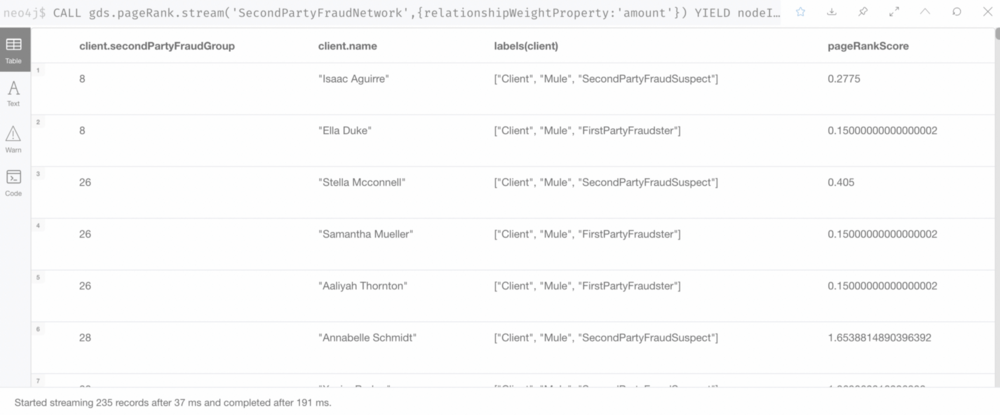
- Use the Centrality Algorithm (Page Rank) to calculate a Fraud Score.
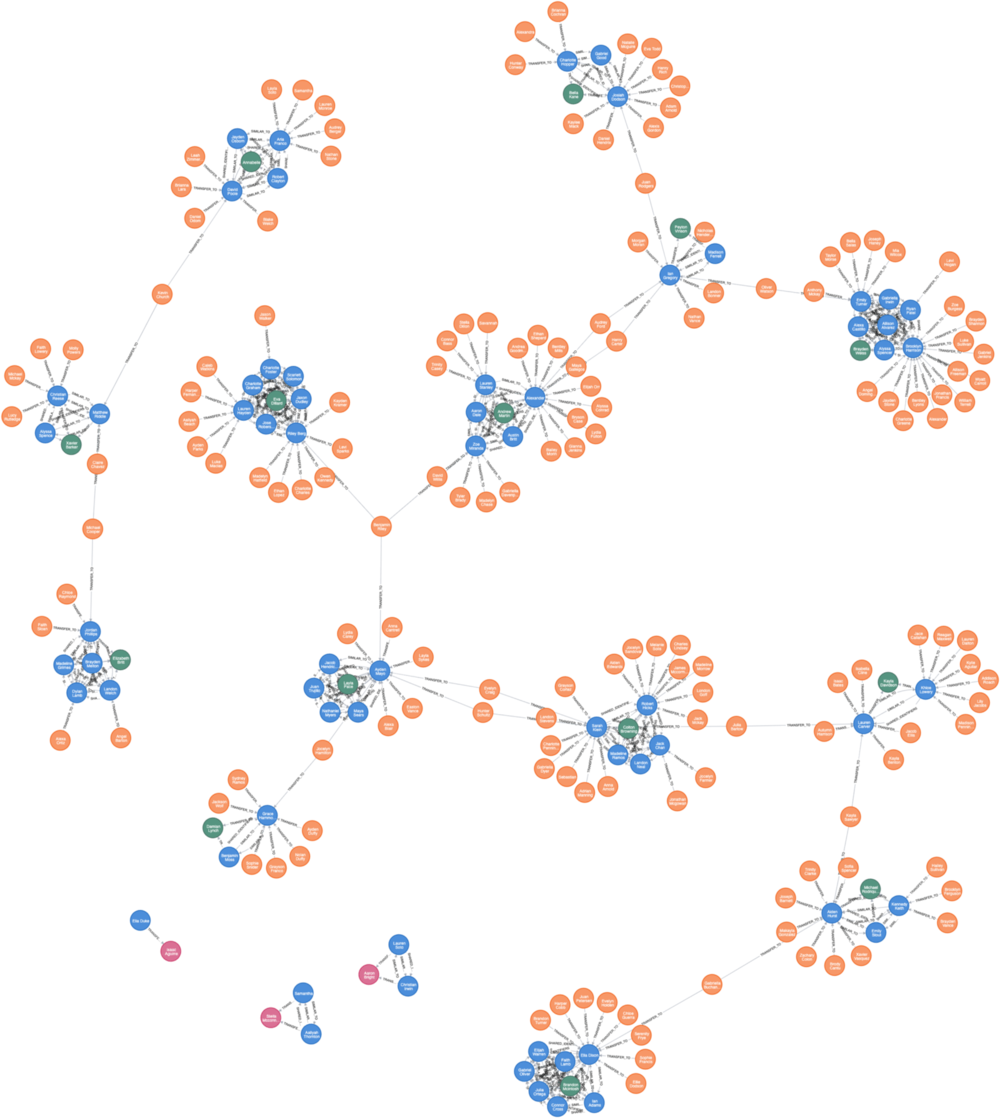
- Identify suspects with relatively high Page Ranks and mark them as 2nd-level fraudsters.
Let's Summarize the First Part: What Did We Find Out?
To sum up, we use GDS to perform financial transaction data analysis:
- We use WCC and Degree Centrality algorithms to filter out potential first-party fraudsters.
- We identify the 2nd-level fraudsters associated with the first-party fraudsters using new fraudsters relationships (TRANFER_TO), WCC and Page Rank algorithms.
- We add labels to these suspects in the current network.
